Blog Articles
How We Optimise $1.2M/Month Google Ads Accounts: The Gap Analysis Framework
Most Google Ads accounts do not need more optimisations. They need to know which one to apply. The internet is full of brilliant checklists and tools, and the problem is not that they are wrong. The problem is they hand you a hundred things you could do and never tell you which one actually matters for your business right now. So operators optimise things that are not broken, and that is the single biggest way to destroy an account.
After more than 10 years and over $115 million in ad spend across hundreds of accounts, the framework we actually use at Market Lead before touching anything is a gap analysis. It is a deliberate, ordered diagnosis that runs from the top of the funnel to the bottom, so by the end you can see exactly where the gap is. Not a guess. A pinpoint. This is the diagnosis, not the optimisation, and getting the diagnosis right is what makes every optimisation that follows actually work.
1. Diagnose Before You Optimise
The order matters as much as the steps. Each pillar depends on the one above it, so you check them top to bottom: traffic quality, traffic quantity, CTR, quality score, CPC, conversion rate, then cost per lead. We colour-code each one as we go, so at the end the gap is visually obvious.
The discipline is simple but rare. If a pillar is healthy, you leave it alone. You only dive deeper on the one that is broken. Most accounts get worse because someone ran a checklist top to bottom on things that were already fine. Find the specific gap first, then fix only that.
2. Start At The Top: Traffic Quality, Then Quantity
Nothing downstream works if the wrong people are arriving. No landing page tweak, no ad change, no bidding trick saves an account fed by irrelevant traffic. So the first question is purely qualitative: pull your search terms from the last 7, 30 and 90 days and ask, are these relevant to my business, yes or no? There is no metric here, because relevance is a judgement call, not a number. If the answer is no, stop. That is your gap, and everything else waits.
If the traffic is relevant, the next question is whether there is enough of it. Plenty of businesses get good-quality traffic but not enough volume to be statistically significant or to produce real lead numbers. As a rough guide on a search campaign, around 100 clicks a week is healthy volume, though it varies by business. When volume is low, there are three causes worth separating:
Low budget. You simply cannot afford more clicks.
Low search impression share. Your bidding is holding you back from showing.
Low search in the market. Nobody is searching, because they are not problem-aware or product-aware. This is when you look to Meta, YouTube, Shopping, LinkedIn or other demand-generation channels instead.
3. The Engagement Signals: CTR And Quality Score
CTR is a forward-looking indicator. It tells you whether you are showing for the right things and whether people are actually clicking, especially on your most relevant search terms. After 10 years, the bands we use are deliberately conservative but generous: 1 to 2% is very poor, 2 to 4% is average, 4 to 7% is great, 7 to 10% is excellent, and anything above is god mode. Ignore anyone who claims a fixed universal number, because CTR naturally drops as you scale into more locations and broader keywords.
Quality score is not a headline metric, but it quietly drives everything: a weak score means fewer impressions, fewer clicks and a higher CPC. Treat 0 to 3 as a red flag, 4 to 6 as average and in need of work, and 7 to 10 as the goal, with 7 to 8 realistic for most. The highest-leverage move here is to find keywords that already convert well but carry a low quality score. That is the lowest-hanging fruit in the entire account, because the demand is proven and only the efficiency is broken.
4. The Economics: CPC, Conversion Rate And Cost Per Lead
This is where most people lie to themselves. There is no universal "good" CPC. Some say $2, some say $50, and both are meaningless. The only honest way is to reverse engineer it from your economics: take a conservative cost-per-lead target and a conservative conversion rate, and back out what a CPC can actually be. A CPC is too high for one of two reasons, and you need to know which: too high for the budget, so it eats your volume, or too high for the economics, so the cost per lead never makes sense.
Conversion rate works the same way. Forget the numbers people throw around online, they are either high rates on low-value offers like a PDF download, or low rates on very high-ticket products. As a conservative website benchmark, above 3% is very good, under 2% suggests a gap. For a landing page, which exists to squeeze a direct response, set the bar higher, above 5% is good. But always judge against two things: industry benchmarks and your own internal KPIs. We run landing pages converting at 4% that are outstanding, because the client value is so high that any lead is gold.
Cost per lead is the scoreboard, and it ties everything together. Work backwards from your business: how many sales do you need, what is your cost-per-sale goal, how many leads to get there, and that gives your cost-per-lead target. Then judge performance against it: under 20% of the KPI is excellent, around the KPI is hitting target, and over 20% above is too high. One caveat: if you are happy to pay more for higher-quality leads, fine, but only if you are actually tracking lead quality, otherwise you are just paying more and hoping.
5. Read The Colour, Fix The One Gap
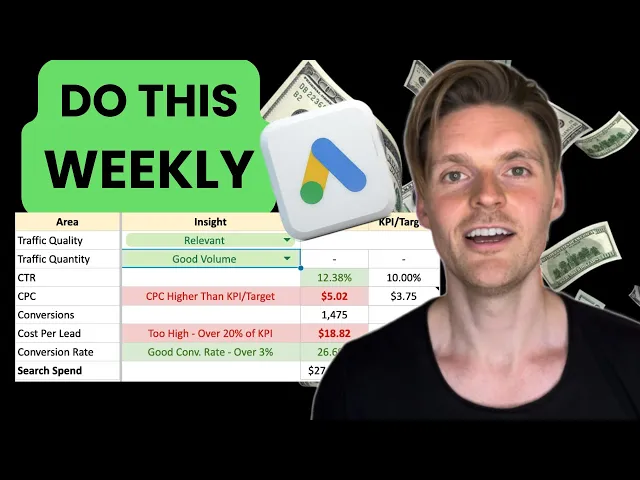
Now lay it all out. For a recent client, the traffic was relevant, volume was strong, CTR was around 12%, quality scores sat in the 7 to 10 range, and the conversion rate was a remarkable 29%. Yet the cost per lead came in around $17 to $18 against a $15 target. With everything else green, the maths makes the gap undeniable: cost per click times conversion rate equals cost per lead, so with conversion already excellent, the only lever left is CPC. That is the gap. That is the one thing to fix.
This is why you have to know your own numbers, your own benchmarks and your own KPIs, then reverse engineer from them. The framework is not just for Google search. We run the same diagnosis for Performance Max, Meta, Bing and other channels, and even for the client's wider business across leads, sales and operations. The principle never changes: find the specific gap before you touch anything.
The Bottom Line
Optimising a Google Ads account is not about doing more. It is about doing the one right thing. Diagnose before you optimise. Check traffic quality and quantity first. Read CTR and quality score as your engagement signals. Reverse engineer CPC, conversion rate and cost per lead from your real economics. Then fix only the pillar that is broken.
Do this and a single change can unlock the whole account. Skip it and you will keep running checklists on things that were never the problem, burning budget while the real gap sits untouched. The whole game is knowing exactly where to look before you decide what to do.