Blog Articles
How I Optimise $1,200,000/Month Google Ads Accounts [Real Tool]
Most advertisers actively destroy their Google Ads accounts by trying to fix things that aren't broken. They download generic "optimization checklists" and blindly apply them, hoping metrics will magically improve.
If you are managing high-ticket or enterprise campaigns, guessing is not a strategy. After managing over $115,000,000 in ad spend, we rely on a strict framework to diagnose underperforming accounts. We call it the Gap Analysis Framework.
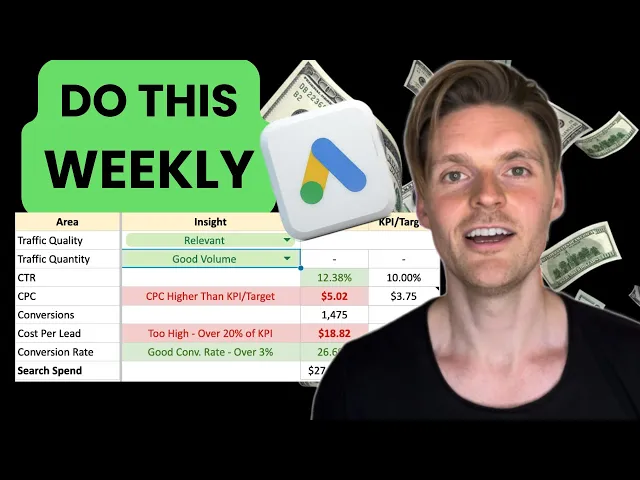
Instead of randomly tweaking bids or rewriting ad copy, you must evaluate your account in a specific, sequential order. Here is the exact 6-pillar system we use to find the true bottleneck in any ad account.
1. Traffic Quality (The Foundation)
If your traffic quality is poor, no amount of landing page optimization will save you. It is the number one driver of results.
Before looking at a single quantitative metric, review your Search Terms report over the last 30 days. Are these search terms highly relevant to your business? Do they carry buying intent? If the algorithm is feeding you irrelevant, low-intent traffic, stop the analysis right here. Fix your keyword targeting and negative keyword lists immediately.
2. Traffic Quantity (Statistical Significance)
If the quality is good, look at the volume. Are you getting enough clicks to make statistically significant decisions? We typically look for a minimum of 100 clicks per week.
Low volume creates fake problems. If you aren't getting enough traffic, you need to identify why: Is your daily budget capping out? Is your Search Impression Share too low due to poor bidding? Or is there simply no search demand in your market for this specific product?
3. Click-Through Rate (CTR)
CTR is a forward-moving indicator of relevance. It tells you if your ad copy actually resonates with the search intent.
Under 2%: Poor. Your ads are irrelevant or your positioning is weak.
4% to 7%: Great.
7% to 10%+: Excellent ("God Mode" for competitive B2B spaces).
4. Quality Score (The Hidden Opportunity)
Quality Score acts as a silent tax (or discount) on your account. A score of 1-3 means your business is burning cash; Google is actively penalizing you.
The lowest hanging fruit in any account audit is finding high-converting keywords that have a low Quality Score (4-6). By improving ad relevance and landing page experience for those specific keywords, you can instantly lower your CPC and scale lead volume.
5. Cost Per Click (CPC) & Unit Economics
What is a "good" CPC? $2? $50?
The truth is, CPC is entirely irrelevant out of context. A good CPC is dictated strictly by your business economics. To know if your CPC is too high, you must reverse-engineer your targets using the fundamental unit economics formula:
$$CPL = \frac{CPC}{CVR}$$
If your target Cost Per Lead (CPL) is $15, and your Conversion Rate (CVR) is 29%, your maximum allowable CPC is dictated by that math. If your CPC is too high for your budget or your CPL goals, it is the gap you must fix.
6. Conversion Rate (CVR) Benchmarks
Do not listen to gurus telling you a 2% conversion rate is "terrible." In highly specialized, high-ticket B2B industries, a 2% CVR can generate millions in revenue.
However, as a general benchmark:
Websites: >3% is good. Under 2% indicates a friction problem.
Dedicated Landing Pages: >5% is good. If a dedicated squeeze page converts at less than 5%, your offer or your page UX is fundamentally broken.
The Bottom Line
When performance drops, do not panic and change everything. Run the Gap Analysis. Find the one specific pillar that is failing, isolate it, and fix it.